|
|
Source Data
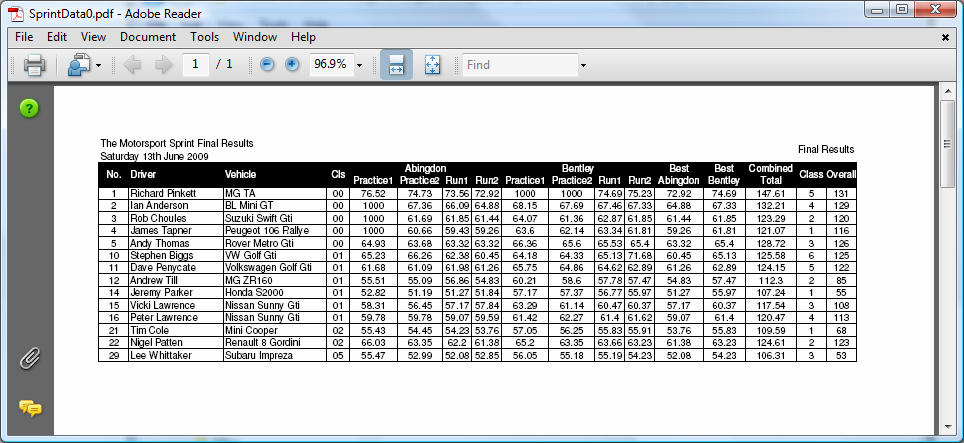
Let's take a look at the source data for this example. Obviously the screenshot shows a spreadsheet, in .pdf format.
The actual data is a part of some timing data from an automotive sprinting event. We've reduced the quantity of data (reduced the row count) for the purposes of this example, simply because it makes it easier to get it in the browser you are using now. The actual .pdf file has some 150 competitors, for each there is a line. Certainly doing this sort of conversion by hand is going to be tedious at best, perhaps error prone at worst.
As you can see the data is in tabular form divided up with rows and columns, just like the spreadsheet it represents. Overall, the data in the reader is just a picture, but we want to be able to graph the individual times in a spreadsheet. The first problem is to get the text data out of the .pdf. This can be accomplished in a straightforward way, by simply using shortcut keys. In Adobe Reader, Ctrl + A selects the whole data, and Ctrl + C copies it out to the clipboard. |