 |
 |
 |
 |
 |
 |
|
3 VMemMgrLike VFU the object VMemMgr, VMM, inherits VFreeList, VFL. The way in which VFL is used by VMM differs significantly from VFU. VFU used the inherited VFL for the storage of a linked list of descriptors, or references to identities. VMM uses VFL for the storage of VHeap instances. Strictly speaking the heap objects should not need to be listed, merely created somewhere and used. In essence nothing directly accesses the heap objects without first referring to an identity within any particular heap. Each identity header maintains a pointer to it’s respective heap object, so once an identity is created VFU is capable of referencing heaps through identities. The end of life for a heap object occurs when the last used identity is deallocated, and it is quite reasonable for VMM to simply delete the heap associated with that current identity. In practice, the heap objects actually have to be stored somewhere. The quantity of data associated with each instance of a VHeap object is not large, but it must go somewhere! In addition for certain debugging and metadata functions it is necessary to have a list of the heap objects so that they and their identities can be iterated. In VMM the VHeap objects are stored in the inherited VFL. There is no direct need for VMM to hold any references to heap objects, because such references are stored in VFL. There is a residual issue with the identities when VFL performs a compaction of the heap objects. In practice this is a rare event, but support must be provided for the references to the parent heap object in each identity. Clearly, when compaction occurs on the heap objects, the “this” pointer for the heap objects change. VMM provides a handler for the VFL notification of compaction, because each of the heap objects must update all of its identities to ensure integrity. HeapCheck is a good example of the need for a list of heap objects. The heap check function spins through each identity, and checks against all of the rules that govern heap operation. It prints anomalies and information about sysmem and usrmem allocations as it goes. Another important consideration is handling allocated identities that have been abandoned on the heap, at the point where an application exits. It is important, although not essential, to be able to examine the heap before the application exits, and establish the nature of any abandoned identities. In respect of this situation and others VMM offers some very useful debugging capabilities that address common heap problems. This “abandoned block” problem is perhaps the most common, and it is possible to set VMM into a debugging mode where each allocated identity receives a unique identifier. On exit, the unique identifier can be established, and a separate routine subsequently compiled into the source. At the point where a block of memory is created, and suspected to be subsequently abandoned, the memory manager will execute a breakpoint. This facility allows one to identify a specific allocation operation that will subsequently cause a leak. This capability is not without some problems. If the block is created deep into operations, sometimes it cannot be guaranteed that the same sequence of operations will occur up to the point where the memory leak is created. The difficulty is that the unique identifier, may not be the same for each instance of program start, to the point of memory leak. Clearly this is essential to pinpoint the leak. To address this specific problem, a mechanism is included which allows the leak tracking identifiers to start being generated at a functional offset into the program. By moving the base of the leak tracking operations closer to the point of the leak, the accuracy of the tracker can be greatly improved. Clearly this is not an exact science, but with practice problems that would otherwise be very difficult to find, can be identified precisely in a very short timespan. Another feature of this tracking mechanism is that it knows about the runtime type information that is stored in the base class of all VObjects. When a pointer dump is performed on the heap, it can attempt to elaborate the runtime type information. Obviously it is unable to elaborate type information for usrmem that does not have a VObject base class, for example a struct, but in many cases it can. This simple scheme is another huge timesaver. If a debug version of an application always runs a pointer dump before exiting the application, just knowing the type of a leaking object immediately the problem occurs reduces the difficulty of finding such problems to almost zero. A heap checking function, enumerates all heap objects, checking the integrity of all the links on the heap. Not only does it iterate identities on the heaps by the list, but it also checks by size, and verifies the content of the free list lookup VFU. The most likely reason for the failure of a heap check, or explicit integrity failure, is that some user function modified memory outside the bounds of the requested usrmem block. This can typically occur when a string is null terminated, and the position of the null terminator is incorrectly evaluated. Such a simple mistake can have huge and fatal consequences. In many cases such an error can lie dormant for some time and strike unexpectedly. To avoid this problem, a checksum facility is provided, that enables an easy test to validate individual identity headers. When the checksum is enabled, every operation on an identity will evaluate and verify the checksum. Buffer overruns can quickly be detected in a debug environment. Like the leak trap, the overrun trap can be invoked dynamically to “root out” a deep overrun. Such an overrun might be detected by intensive checking of the sums of all identities on the heap, and this is associated with a significant performance degradation. Delaying the start of intensive checking allows the user to get to the general vicinity of the problem without using vast amounts of CPU time. Again, like the leak trap, with practice overruns can be precisely identified in very little time. Another feature of VMM is it’s heap statistics capability. The screenshot below shows the typical statistics output from VMM; 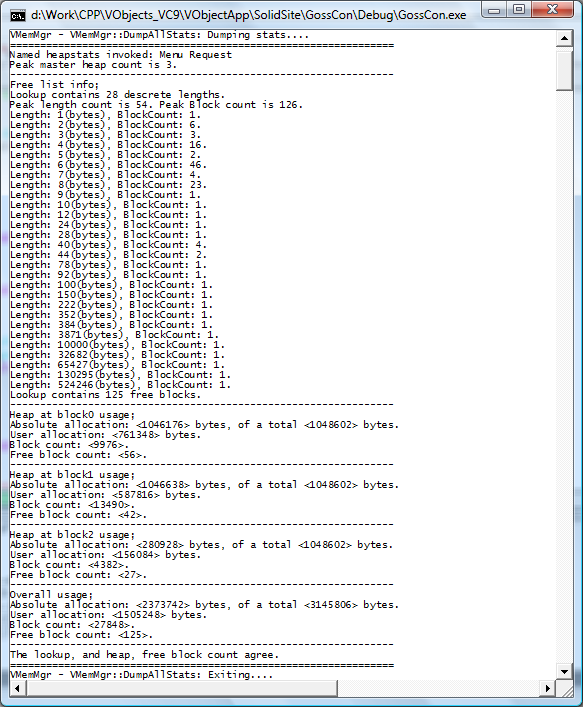 This screenshot is taken from the GossConsole application which for debugging purposes has a menu link to the VMM “heapstats” debugging function. At the point where this screenshot was taken GossConsole had a document open, hence the significant amount of information. Peak master heap count indicates the number of maximum number of VHeap objects created to the point where the stats function is run. The next section refers to the “FreeList” which is analogous to the content of VFU. The name refers, perhaps confusingly, to the Free List of Identities. Peak length count is the maximum number of discrete identity lengths in the free list. Peak block count is the peak count of free identities irrespective of length. The next section shows a histogram of instantaneous identity lengths and their associated counts, and is very useful for assessing heap fragmentation. The remaining sections represent the status of each of the heap objects, where the final section is simply an aggregation of the data in each heap section. In these sections “absolute allocation” is the aggregate size of all allocated identities (those that include user data) and “total” is the size of the heap. Since each identity contains some header information the user allocation is somewhat less than the absolute allocation. The user allocation usrmem, is the total memory that the user requested. That quantity is a result of “block count” individual requests on the given heap, and “free block count” is a count of unallocated blocks on the given heap. It can be seen from the heap statistics that the heap is in pretty good shape. The vast majority of the unallocated 0.7megabytes of memory is in chunks of a meaningful size (>3Kbytes). Although 3MB has been allocated from the system to achieve around 1.5MB of user allocation, we have seen that just under 1MB is “in hand” and this is where the speed improvement comes from. The actual allocation ratio, is around 1.5:1, absolute to user. This may seem excessive, but the single most obvious reason for this is that the majority of the user allocations are around the same size as the identity header. Since the initial purpose of the VMM unit was to improve performance of small block allocation, this seems acceptable. In practice there are two ways to improve this situation, the first is to reduce the size of the identity header, which is done by disabling all of the debugging functionality. The second is to increase the size of the blocks requested by the application. VMM represents the core interface with an application. Although the elements of the overall memory manager could be used in a standalone capacity, we offer other modules which offer similar capabilities in a more useable form. It is recommended that VMM is treated as a module and accessed through the main VMM Functions. The most straightforward means of implementing VMM is to create it as a namespace global object, and to either use it’s alloc, realloc and free members directly, or to overload your own new and delete operators to call VMM. An exhaustive list of the intended entypoints follows; 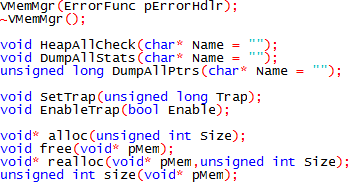 The final notable feature of VMM is that it provides a reliable “size” capability. Not all memory managers that we have used implement this feature completely, and it can be particularly useful, from a performance perspective, when dealing with strings. |


Copyright © Solid Fluid 2007-2025 |
Last modified: SolFlu Fri, 05 Jun 2009 22:32:42 GMT |